Benchmarking Methodology
Overview
This document describes the systematic approach used to benchmark REST service implementations, aiming for results that are reproducible, comparable, and transparent.
Where details differ between documentation and code/config, the repository source (Docker/compose/service implementations) is the source of truth.
At-a-glance results (17/05/2026)
The table below is a curated summary (RPS rounded to the closest thousand) for CPU-limited service containers (2 vCPUs).
| Framework | Runtime | Mode | RPS | Peak Mem (MB) | Image Size (MB) |
|---|---|---|---|---|---|
| Spring | JVM | Platform | 21k | 552 | 248 |
| Spring | JVM | Virtual | 17k | 439 | 248 |
| Spring | JVM | Reactive | 14k | 427 | 278 |
| Spring | Native | Platform | 10k | 237 | 388 |
| Spring | Native | Virtual | 11k | 163 | 388 |
| Spring | Native | Reactive | 7k | 176 | 431 |
| Quarkus | JVM | Platform | 37k | 540 | 237 |
| Quarkus | JVM | Virtual | 45k | 540 | 237 |
| Quarkus | JVM | Reactive | 49k | 540 | 237 |
| Quarkus | Native | Platform | 21k | 270 | 623 |
| Quarkus | Native | Virtual | 27k | 270 | 623 |
| Quarkus | Native | Reactive | 22k | 270 | 623 |
| Micronaut | JVM | Platform | 31k | 441 | 195 |
| Micronaut | JVM | Virtual | 38k | 441 | 195 |
| Micronaut | JVM | Reactive | 33k | 441 | 195 |
| Micronaut | Native | Platform | 17k | 165 | 343 |
| Micronaut | Native | Virtual | 17k | 165 | 343 |
| Micronaut | Native | Reactive | 15k | 165 | 343 |
| Helidon SE | JVM | Virtual | 65k | 430 | 178 |
| Helidon SE | Native | Virtual | 37k | 195 | 258 |
| Helidon MP | JVM | Virtual | 15k | 463 | 196 |
| Helidon MP | Native | Virtual | 10k | 202 | 362 |
| Spark | JVM | Platform | 35k | 559 | 216 |
| Spark | JVM | Virtual | 25k | 395 | 216 |
| Javalin | JVM | Platform | 29k | 754 | 221 |
| Javalin | JVM | Virtual | 26k | 510 | 221 |
| Dropwizard | JVM | Platform | 17k | 613 | 247 |
| Dropwizard | JVM | Virtual | 16k | 529 | 247 |
| Vert.x | JVM | Reactive | 52k | 541 | 222 |
| Pekko | JVM | Reactive | 30k | 693 | 267 |
| Go | Native | Goroutines | 24k | 120 | 37 |
| Django | CPython | Platform | 1k | 161 | 320 |
| Django | CPython | Reactive | 0.7k | 200 | 323 |
Fairness Notes
- Helidon 4 is virtual-thread–first; reactive HTTP server mode was removed in v4 → other modes are N/A by design.
- Helidon JVM builds have been optimized with jlink which reduces image size significantly.
- Helidon MP adds MicroProfile CDI/JAX-RS overhead on top of the SE engine.
- Micronaut somewhat combines reactive and virtual threads with its experimental loom carrier property (in-use for jvm, not supported in native).
- Javalin supports virtual threads (blocking on VT) but does not provide a reactive HTTP model.
- Spark Java is blocking-only in its official latest version, with also virtual threads support via its Zoomba fork.
- Dropwizard 5.x runs on Jetty 12 + Jersey 3; thread mode (platform or virtual) is selected at startup via
THREAD_MODEenv var. No reactive HTTP model. - Vert.x 5.x is a fully reactive, event-loop–based framework (Netty); only the reactive endpoint is benchmarked — platform and virtual thread modes are N/A by design.
- Pekko 1.3.0 is a fully reactive HTTP toolkit running on the Pekko actor system’s ForkJoin dispatcher; only the reactive endpoint is benchmarked — platform and virtual thread modes are N/A by design. The module uses direct Pekko HTTP.
- Django 6.0.6 runs on CPython 3.13.14 behind Gunicorn. The platform module uses
gthread(threaded WSGI) workers; the reactive module usesUvicornWorker(ASGI). Python’s GIL limits true parallelism; throughput is significantly lower than JVM and Go implementations — included for cross-language comparison. - Reactive means true non-blocking HTTP pipelines (event loop + backpressure), not “blocking code wrapped in reactive types.”
- Native builds use GraalVM Native Image with framework-recommended settings.
- All tests:
- same endpoint logic
- similar payload sizes
- keep-alive enabled
- no TLS
- identical load profiles
- inside the same docker network
- go vs go-simple
- You may notice a higher-RPS Go variant in the repo (
go-simple) with results around ~60k RPS. - That implementation is intentionally kept out of the “like-for-like” headline comparison because it does not run with an observability setup equivalent to the Java services.
- The newer Go implementation targets a more apples-to-apples comparison (OpenTelemetry + the same pipeline), so it’s the one summarized here.
- You may notice a higher-RPS Go variant in the repo (
Benchmarking Philosophy
Goals
- Fair Comparison: Create equivalent test conditions for all implementations
- Reproducibility: Enable others to reproduce results
- Practical Relevance: Test realistic scenarios while maintaining simplicity
- Transparency: Document all assumptions and limitations
Non-Goals
- Comprehensive real-world application benchmarks
- Vendor-neutral framework comparison (some bias exists)
- Production performance prediction
- Marketing material generation
Test Environment
Hardware Configuration
Host System:
- CPU: Intel i9-14900HX (24 cores, 32 threads)
- RAM: 32 GB DDR5
- Storage: NVMe SSD
- OS: Windows 11 with WSL2 (kernel 6.6.114.1-microsoft-standard-wsl2)
Note: Results vary significantly with hardware. Always benchmark on target hardware.
Container Configuration
Resource Limits:
cpus: 2.0          # 2 virtual CPUs
memory: 2GB        # Maximum memory
Why CPU Limiting?
- Creates fair comparison across implementations
- Prevents a single service from monopolizing resources
- Simulates production resource constraints
- Easier to detect efficiency differences
Software Versions
Java:
- JDK: Eclipse Temurin 25.0.3
- JVM Options:
-XX:+UseG1GC -XX:MaxGCPauseMillis=100 - Heap: 512MB-1GB depending on implementation
Native:
- GraalVM: 25.0.3 (Oracle Enterprise edition)
- GC: G1 (only available in Enterprise edition)
- Build: Optimized for throughput (
-O3)
Frameworks:
- Spring Boot: 4.1.0 (3.5.15 also supported)
- Quarkus: 3.36.2
- Micronaut: 5.0.3
- Helidon: 4.4.1
- Spark: 3.0.4
- Javalin: 7.2.2
- Dropwizard: 5.0.2
- Vert.x: 5.0.12
- Pekko: 1.3.0 (Pekko Core 1.4.0)
- Go: 1.26.4 with Fiber v3.3.0
- Python: 3.13.14 (CPython)
- Django: 6.0.6 (Gunicorn 26.0.0)
Third-party license note (native-image)
This repository is Apache-2.0 licensed.
However, native builds may use Oracle GraalVM container images (for example: container-registry.oracle.com/graalvm/native-image:25.0.3-ol9). If you build or run those images, you are responsible for reviewing and complying with Oracle’s license terms.
Workload Design
Service Implementation
Endpoint: GET /hello/platform
Logic:
@GetMapping("/hello/platform")
public ResponseEntity<String> getFromCache() {
    String value = cache.get(key, k -> "value-" + k);
    return ResponseEntity.ok(value);
}
Cache: Caffeine (high-performance, non-blocking)
- Max size: 10,000 entries
- No expiration
- Pre-warmed with 1,000 entries
Why This Workload?
- Focuses on concurrency handling
- Minimal business logic noise
- Non-blocking I/O where applicable
- Predictable, consistent response time
- Representative of microservice patterns
Load Generation
Tool: wrk2 (constant throughput load generator)
Configuration:
wrk2 -t 8 \                    # 8 threads
     -c 200 \                  # 200 connections
     -d 180s \                 # 180 second duration
     -R 80000 \                # 80,000 requests/sec target
     --latency \               # Latency distribution
     http://service:8080/hello/platform
Key Parameters:
- Threads: Match CPU cores for efficiency
- Connections: Sufficient to saturate service
- Duration: Long enough for JVM warmup (3+ minutes)
- Rate: Set above expected maximum (service becomes bottleneck)
Why wrk2?
- Constant throughput (not open-loop)
- Coordinated omission correction
- Latency distribution tracking
- Deterministic load pattern
Benchmarking Process
Before you run benchmarks (recommended)
To maximize repeatability:
- Reboot the host machine before benchmark sessions.
- Minimize background processes (IDEs, downloads, antivirus scans, etc.).
- Check your CPU topology (especially mixed performance/efficiency core designs) and consider pinning/affinity to avoid noisy neighbor effects.
Native-image build time & resource notes
Native-image builds are CPU intensive and can take up to ~10 minutes per service. First-time builds of the full set can take 30+ minutes.
Building multiple native images in parallel can overwhelm Docker Desktop/WSL2. The repository therefore defaults to serial image builds using:
COMPOSE_PARALLEL_LIMIT=1
1. Preparation Phase
Environment Setup:
# Start observability stack
docker compose --project-directory compose --profile=OBS up -d

# Wait for all services to be healthy (60 seconds minimum)
sleep 60
Windows PowerShell alternative:
Start-Sleep -Seconds 60
Service Deployment:
# Start specific service
docker compose --project-directory compose --profile=SERVICES up -d service-name

# Wait for service warmup
sleep 30
Windows PowerShell alternative:
Start-Sleep -Seconds 30
Health checks can be verified with curl (or a browser):
- Spring:
/actuator/health - Quarkus:
/q/health
2. Warmup Phase
Purpose: Allow JVM to reach steady-state performance
- JIT compilation
- Class loading
- Cache population
- Connection pool warmup
Procedure:
# Low-rate warmup (30 seconds)
wrk2 -t 4 -c 50 -d 30s -R 10000 http://localhost:8080/hello/platform

# Wait for GC to settle
sleep 10

# Medium-rate warmup (30 seconds)
wrk2 -t 6 -c 100 -d 30s -R 30000 http://localhost:8080/hello/platform

# Wait for stabilization
sleep 10
Native Images: Shorter warmup acceptable (instant startup)
3. Measurement Phase
Primary Benchmark:
# Full load test
wrk2 -t 8 -c 200 -d 180s -R 100000 --latency \
     http://localhost:8080/hello/platform > results.txt
What to Capture:
- Requests per second (actual achieved)
- Latency distribution (p50, p90, p99, p99.9)
- Error rate
- CPU utilization (from Docker stats)
- Memory usage (heap and RSS)
- GC events (from JVM logs)
Observability Data:
- Open Grafana during test
- Capture screenshots of dashboards
- Export Prometheus metrics
- Save trace samples
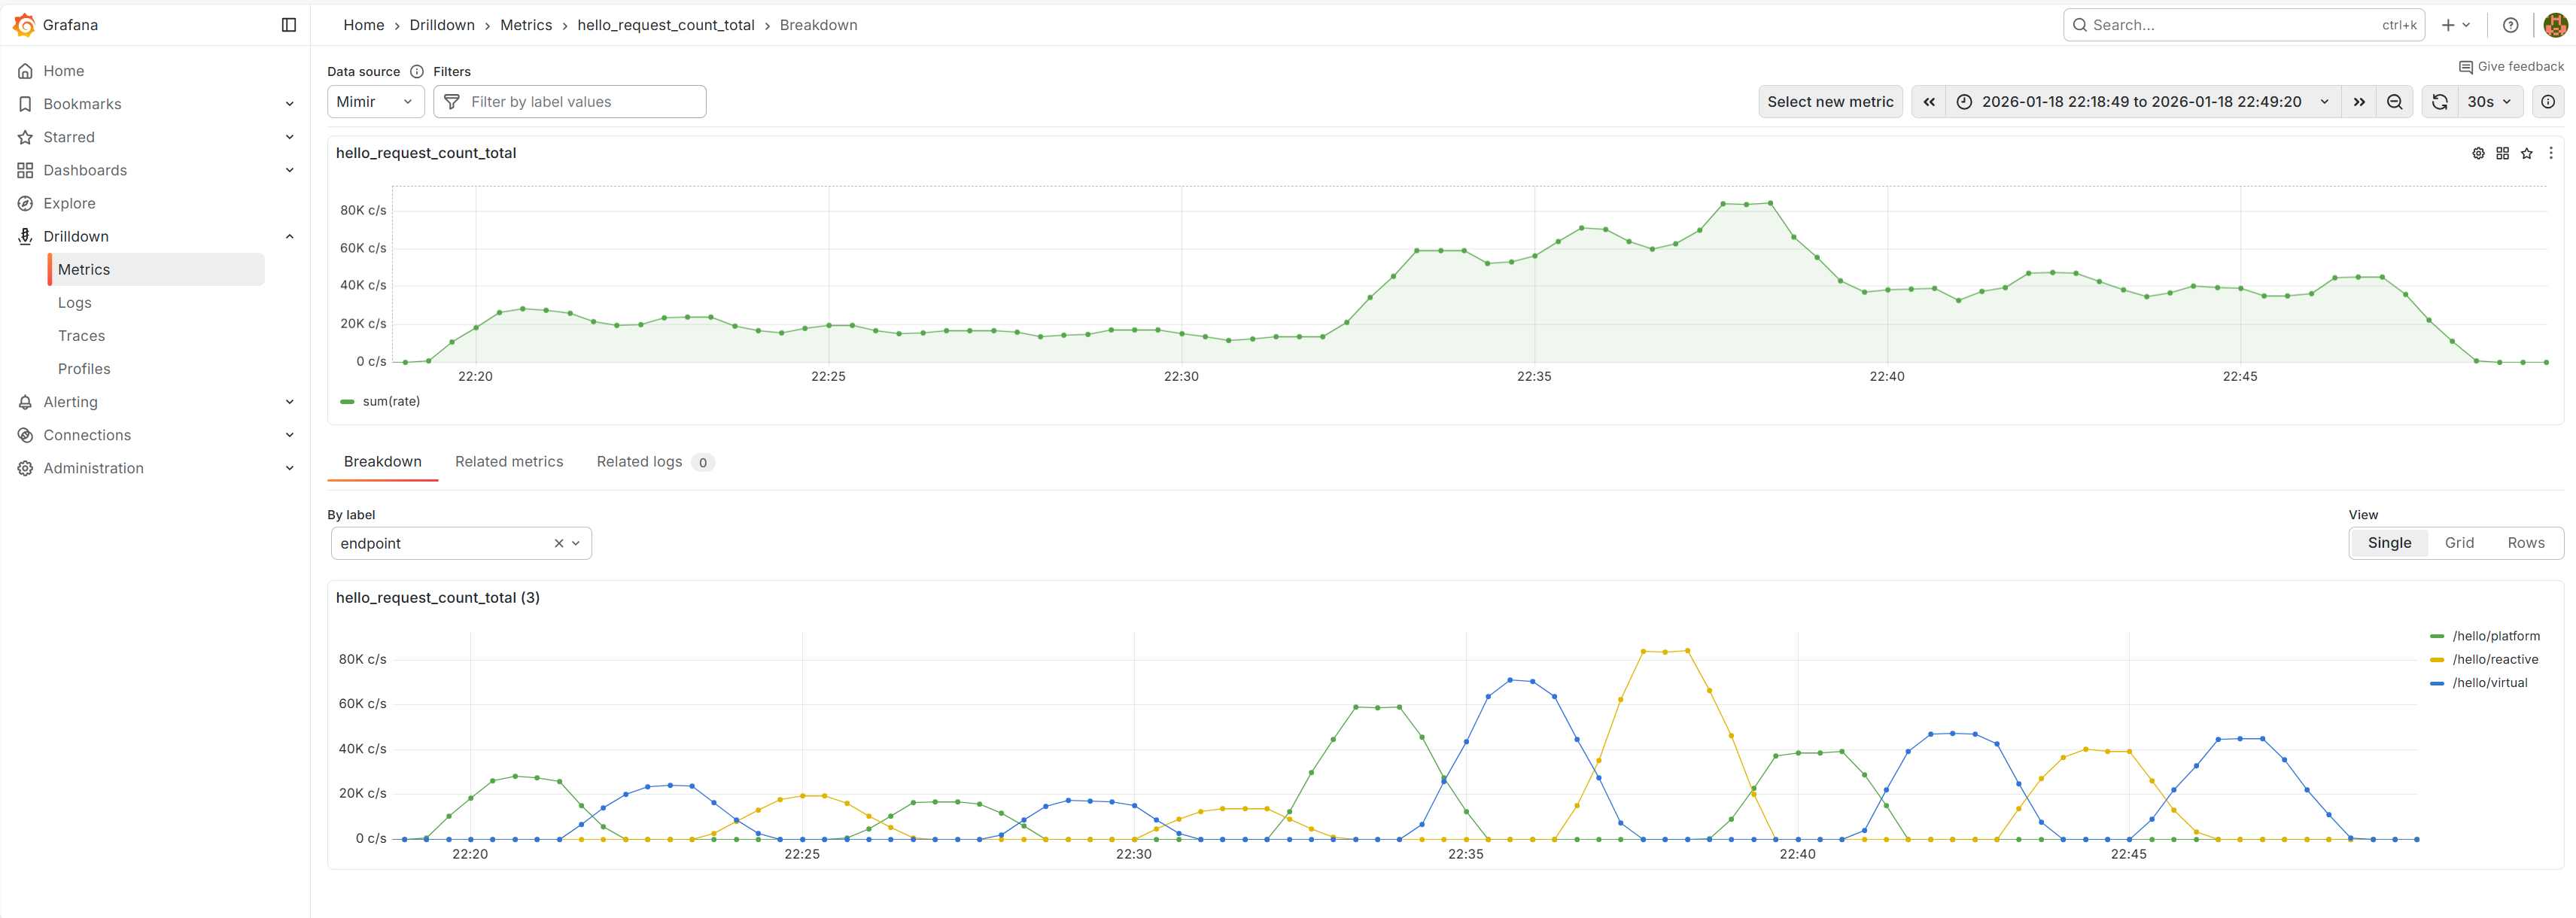
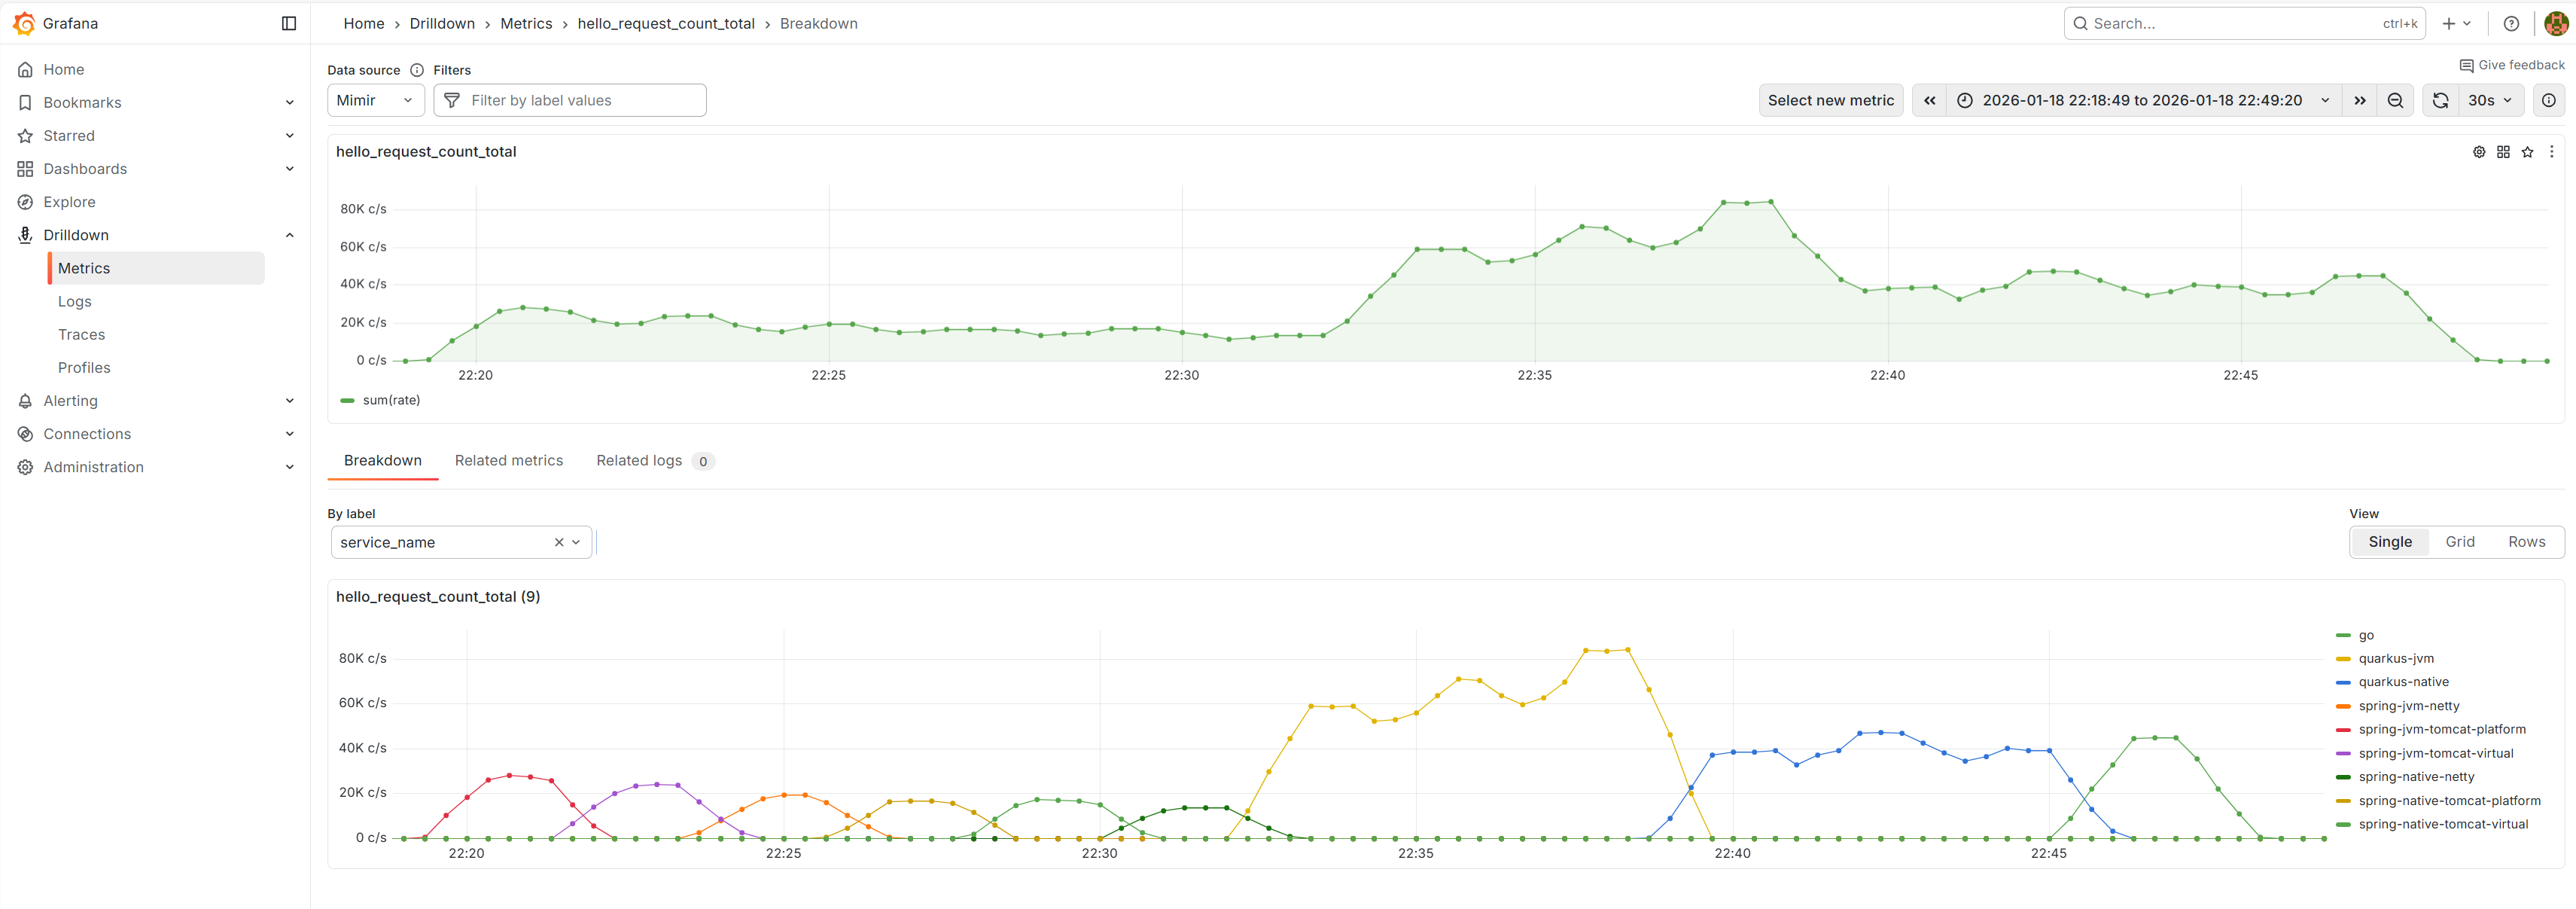
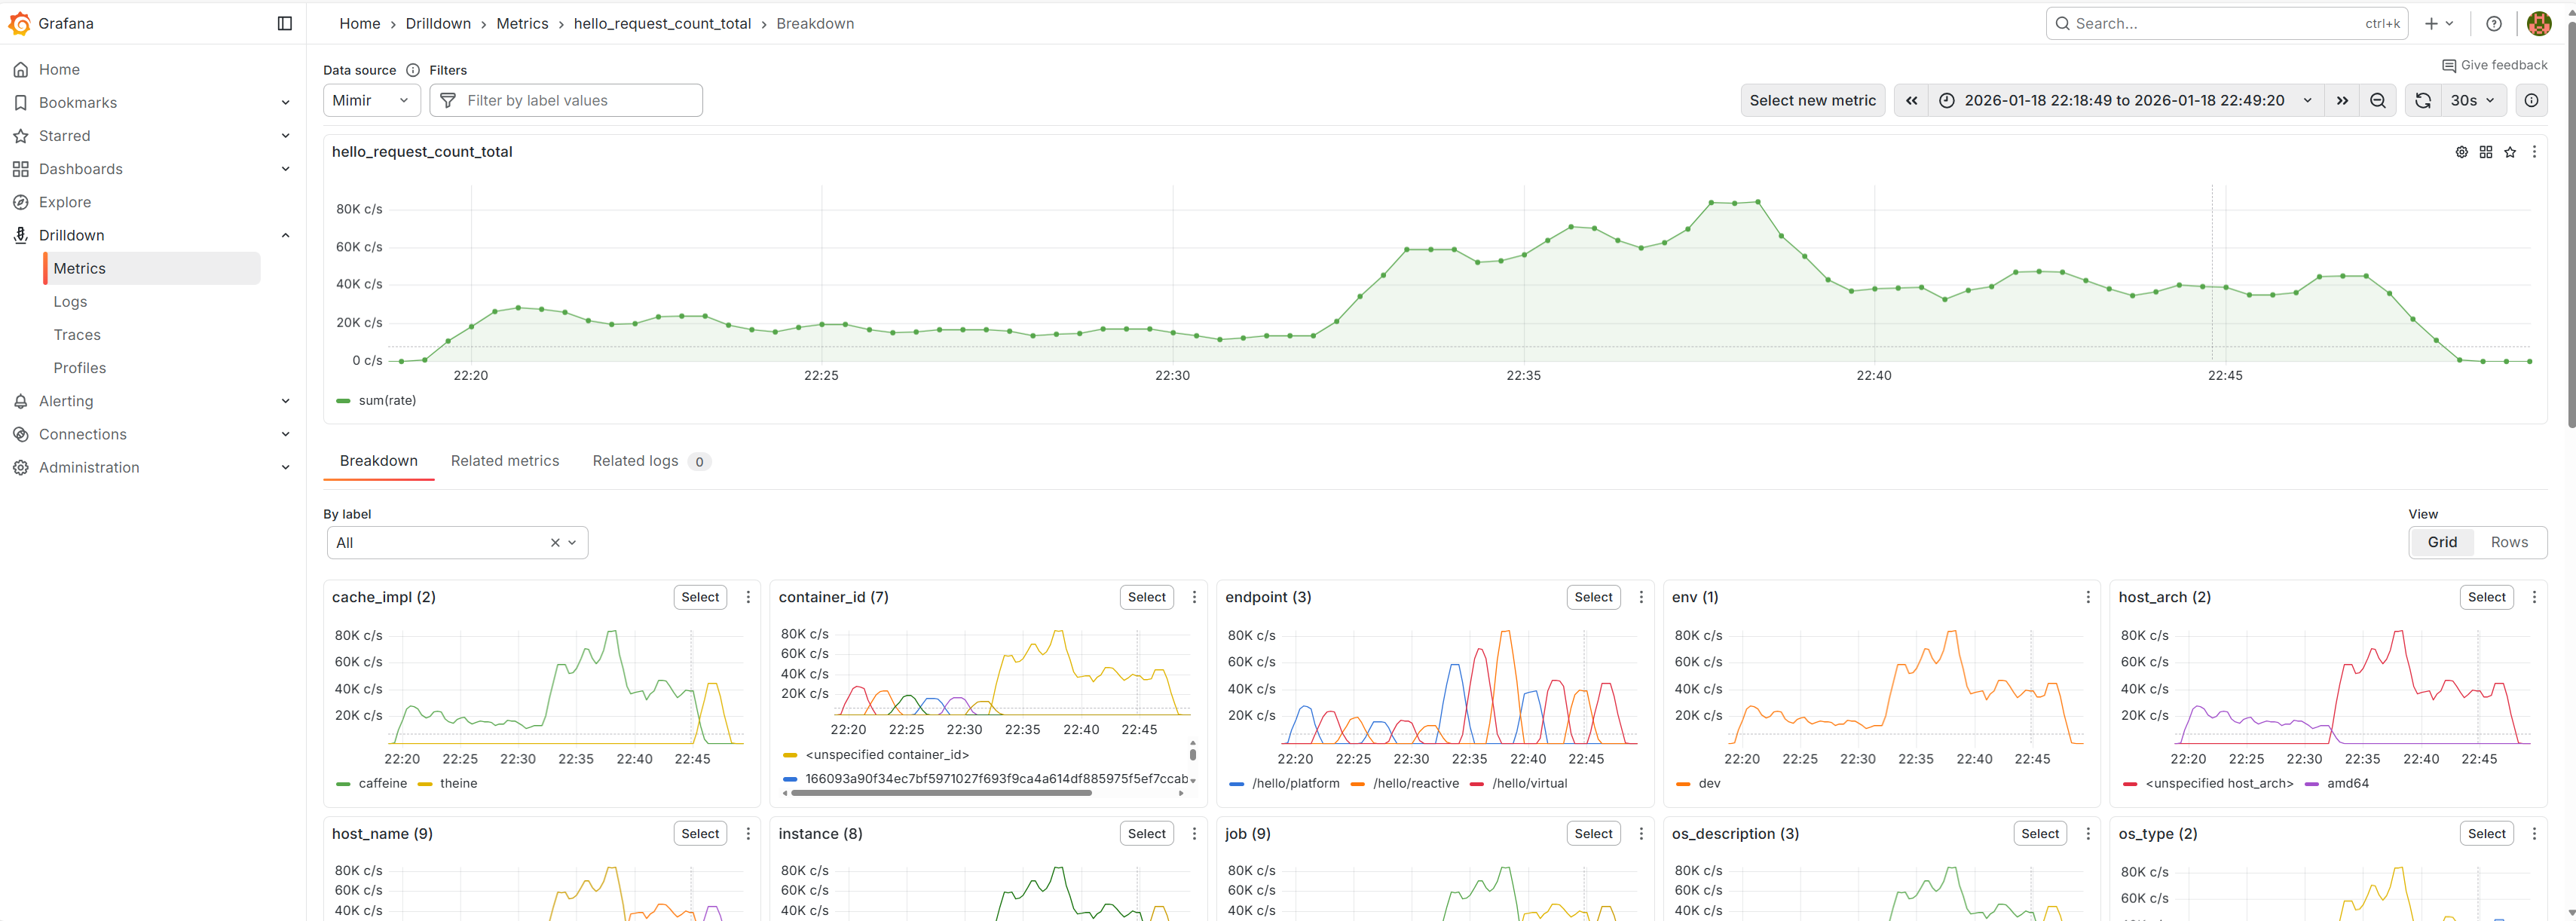
Example: request rate drilldown (Grafana)
These are examples of how request rate can be inspected via hello_request_count_total and then broken down by labels like service_name and endpoint.
4. Cooldown Phase
# Stop load generator
docker compose --project-directory compose --profile=RAIN_FIRE down

# Wait for queues to drain
sleep 30

# Capture final metrics
docker stats --no-stream
Windows PowerShell alternative:
Start-Sleep -Seconds 30

docker stats --no-stream
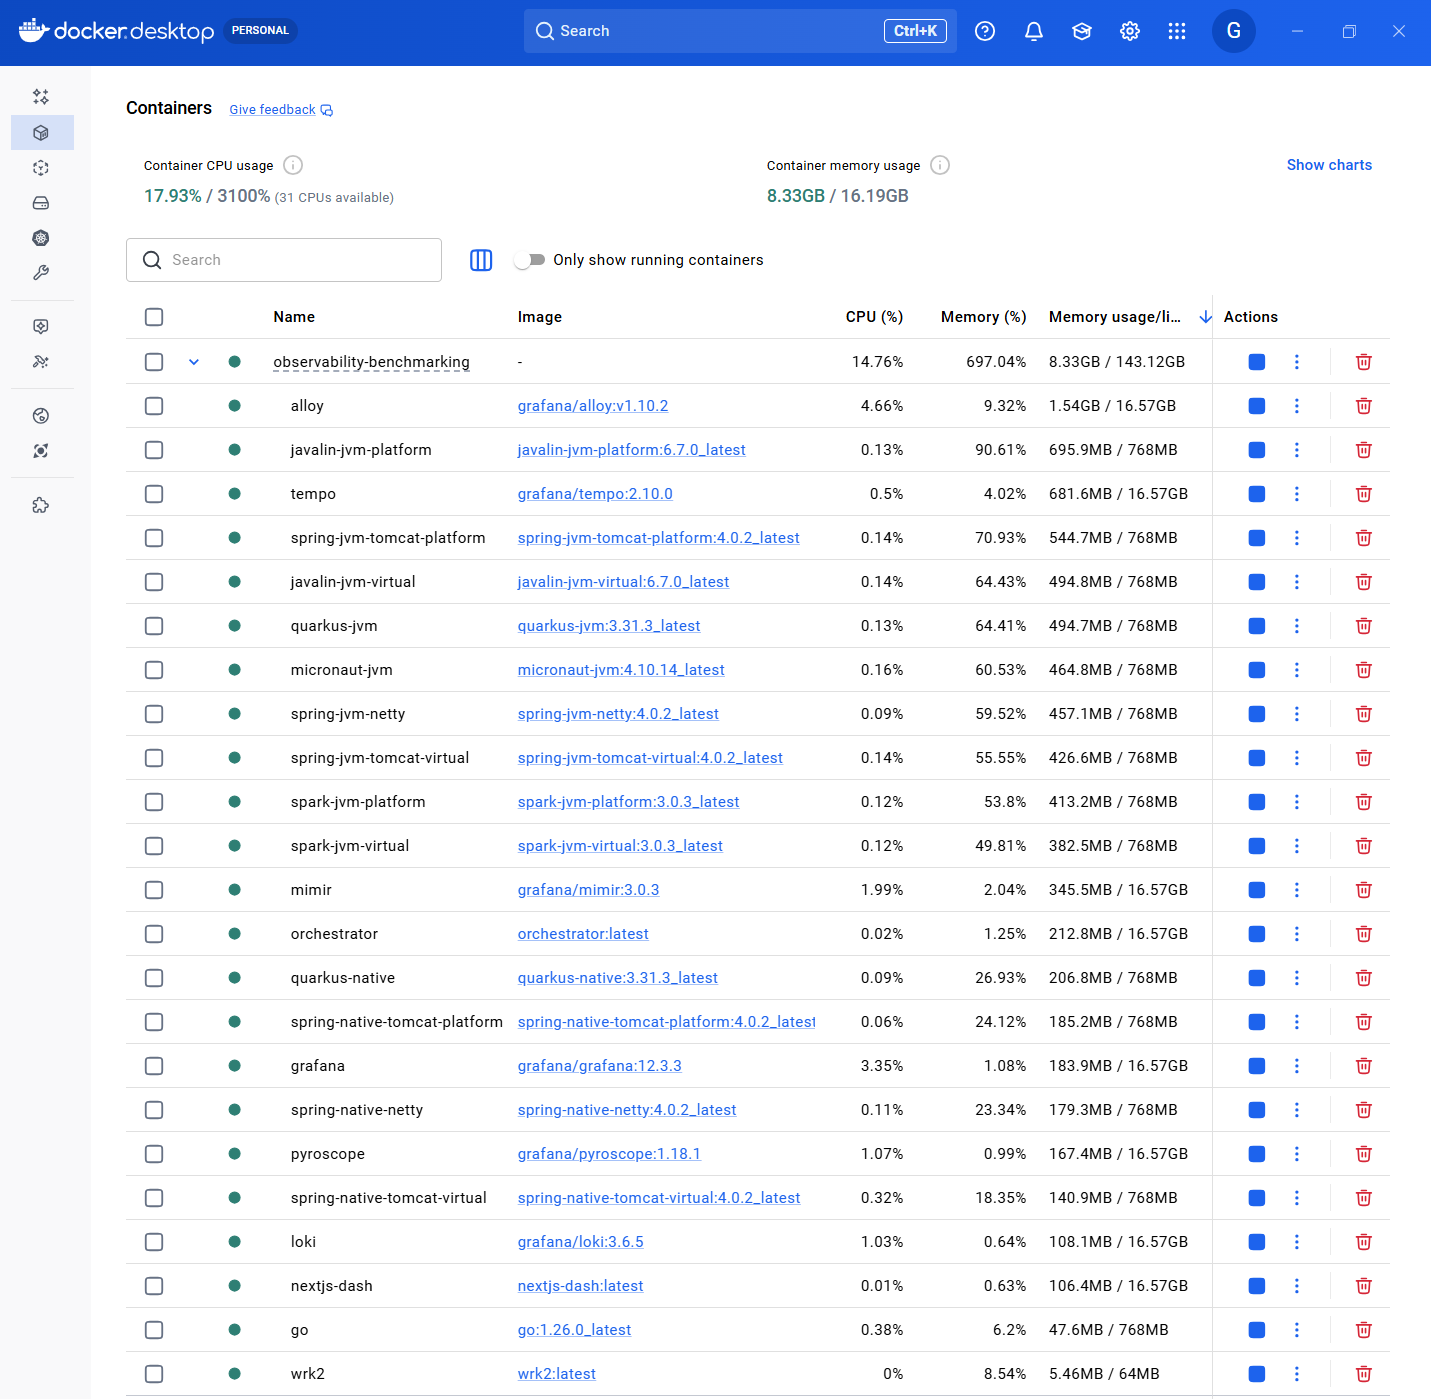
Example: capturing peak memory in Docker Desktop
When summarizing peak memory, it’s useful to capture a “post-benchmark” snapshot of container memory usage (either via docker stats or Docker Desktop).
5. Data Collection
Automated:
- wrk2 output saved to
/results/ - Grafana snapshots exported
- Docker stats logged
Manual:
- Screenshot key dashboards
- Note any anomalies
- Record configuration details
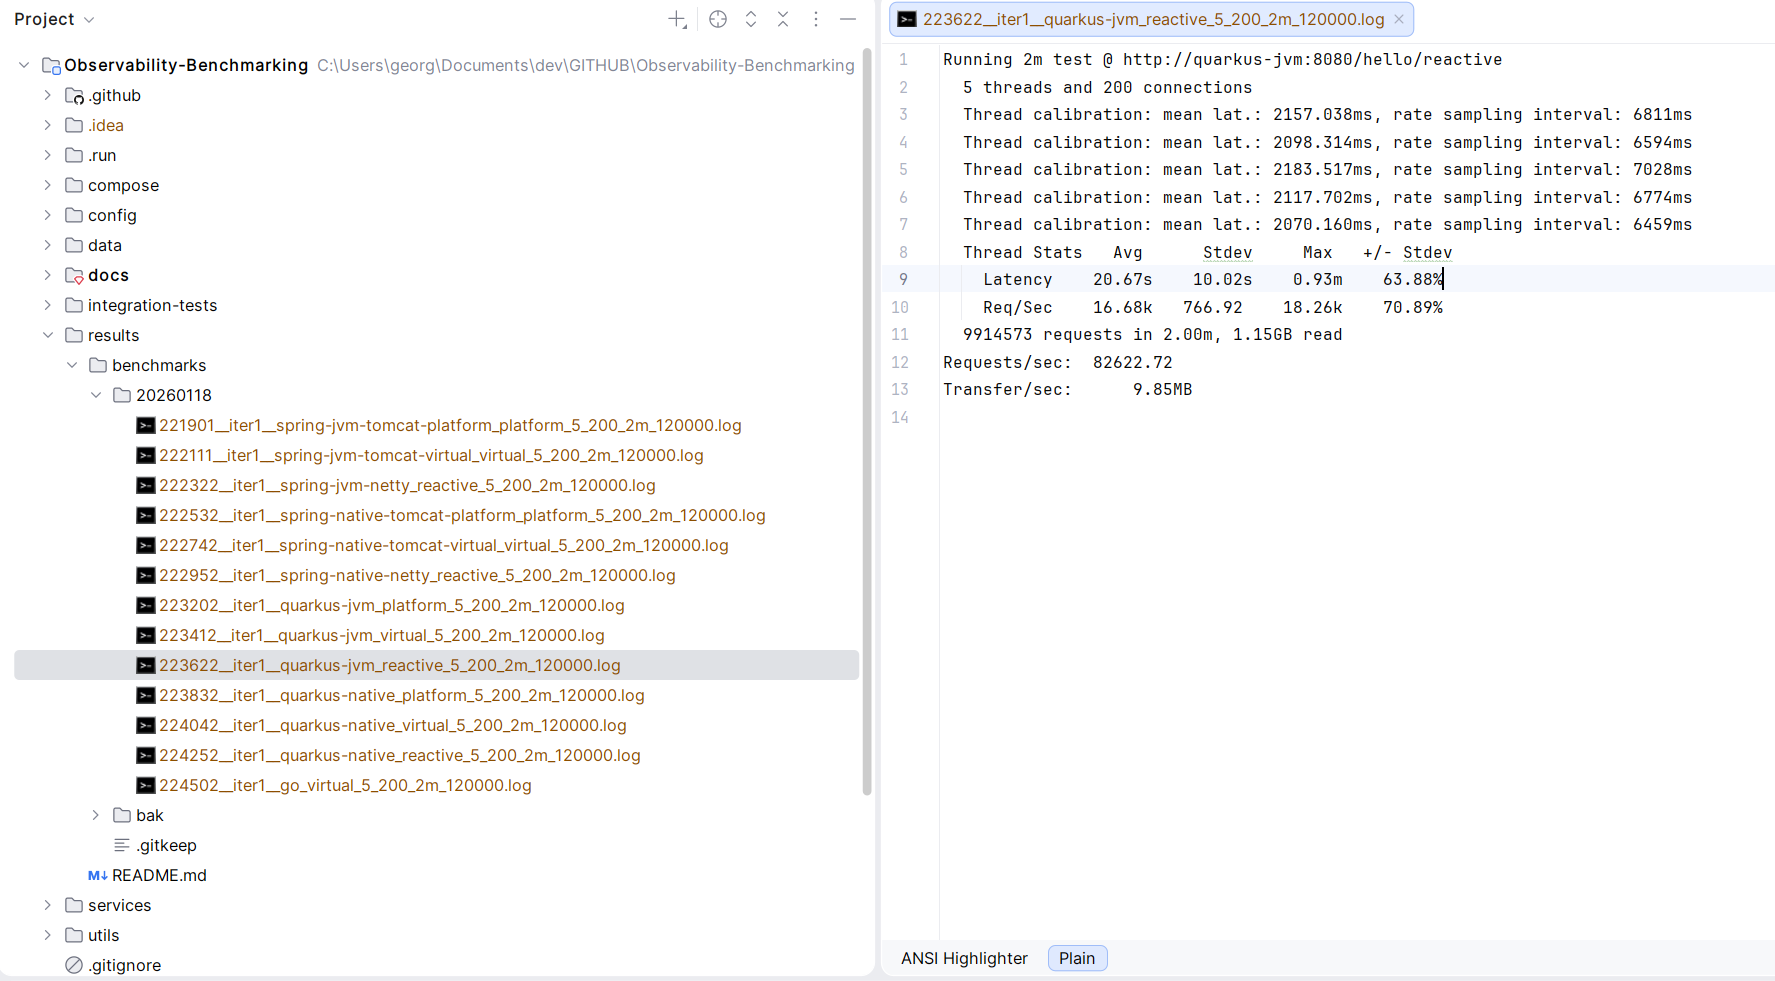
Example output artifacts
The repository stores benchmark artifacts under results/ (see results/README.md).
Result Interpretation
Primary Metrics
Requests Per Second (RPS):
- Actual throughput achieved
- Limited by service capacity
- Higher is better (but not the only metric)
Latency Percentiles:
- p50: Median (typical user experience)
- p99: Worst 1% (reliability indicator)
- p99.9: Tail latency (system stability)
CPU Utilization:
- Should approach 100% under max load
- Lower than 100% indicates other bottleneck
- Efficiency = RPS / CPU%
Memory Usage:
- Heap utilization pattern
- GC frequency and duration
- Native memory (RSS)
Secondary Metrics
Startup Time:
- Time to first request
- Relevant for serverless and scaling
Memory Footprint:
- Baseline RSS
- Relevant for cost optimization
Error Rate:
- Should be 0% for valid comparison
- Non-zero indicates configuration issue
Comparing Results
Fair Comparison Checklist
✓ Same hardware: All tests on same machine
✓ Same resource limits: CPU and memory constraints identical
✓ Same workload: Identical request pattern
✓ Same warmup: Adequate warmup time for each
✓ Multiple runs: At least 3 runs, report median
✓ Same observability: Instrumentation overhead consistent
Common Pitfalls
❌ Cold start bias: Insufficient warmup
❌ Thermal throttling: CPU temperature limiting performance
❌ Background processes: Other workloads affecting results
❌ Network saturation: Localhost loopback as bottleneck
❌ Observer effect: Observability overhead not accounted for
Statistical Rigor
Multiple Runs
Minimum: 3 runs per configuration
Report: Median RPS, range
Discard: Outliers with clear explanation
Variance Analysis
Acceptable: ±5% between runs
Investigate: >10% variance suggests instability
Significance
Results presented are indicative, not scientific proof
- No formal hypothesis testing
- Sample size not statistically significant
- Designed for relative comparison
Known Limitations
Workload Simplicity
- Real applications have more complex logic
- Database I/O not tested
- Network latency not simulated
- Doesn’t test all framework features
Local Testing
- Single machine limits scale
- No distributed tracing overhead
- No network partitions
- No deployment complexity
Tool Limitations
- wrk2 uses Lua scripting (adds overhead)
- Docker networking introduces latency
- WSL2 has performance implications
- CPU affinity not controlled
Recommendations for Reproducibility
Before Benchmarking
- Close unnecessary applications: Minimize interference
- Disable power management: Maximum performance mode
- Fix CPU frequency: Avoid turbo boost variations
- Warm up system: Run a test benchmark first
- Check thermals: Ensure adequate cooling
During Benchmarking
- Monitor system: Watch for anomalies
- Consistent time of day: Avoid thermal variations
- Multiple iterations: Don’t trust single run
- Document everything: Configuration, versions, observations
After Benchmarking
- Review observability data: Correlate with results
- Check for errors: Validate test validity
- Compare with baseline: Detect regression
- Archive results: Include metadata
Advanced Benchmarking
Latency Profiling
Use flamegraphs to identify hot paths:
# Pyroscope captures automatically during test
# View in Grafana: Explore → Pyroscope
Concurrency Scaling
Test different connection counts:
for conn in 50 100 200 400; do
    wrk2 -t 8 -c $conn -d 60s -R 100000 http://localhost:8080/hello/platform
done
Stress Testing
Find the breaking point:
for rate in 50000 100000 150000 200000; do
    wrk2 -t 8 -c 200 -d 60s -R $rate http://localhost:8080/hello/platform
done
References
- How NOT to Measure Latency - Gil Tene
- Coordinated Omission - Gil Tene
- wrk2 Documentation
- Systems Performance - Brendan Gregg
Continuous Improvement
This methodology evolves based on:
- Community feedback
- New tools and techniques
- Lessons learned from additional runs
- Framework-specific optimizations discovered
Contributions and suggestions welcome via GitHub issues!